




Earth’s delicate atmosphere holds a vital secret: the ozone layer, our planet’s natural sunscreen. This invisible shield protects all life from the sun’s most dangerous ultraviolet rays. But where exactly does this crucial layer reside, and how can an amateur scientist uncover its secrets? This article delves into the fascinating world of atmospheric science, guiding you through a surprisingly accessible DIY method to measure the ozone layer’s peak altitude, echoing the pioneering spirit of early atmospheric researchers.
What is the Ozone Layer?
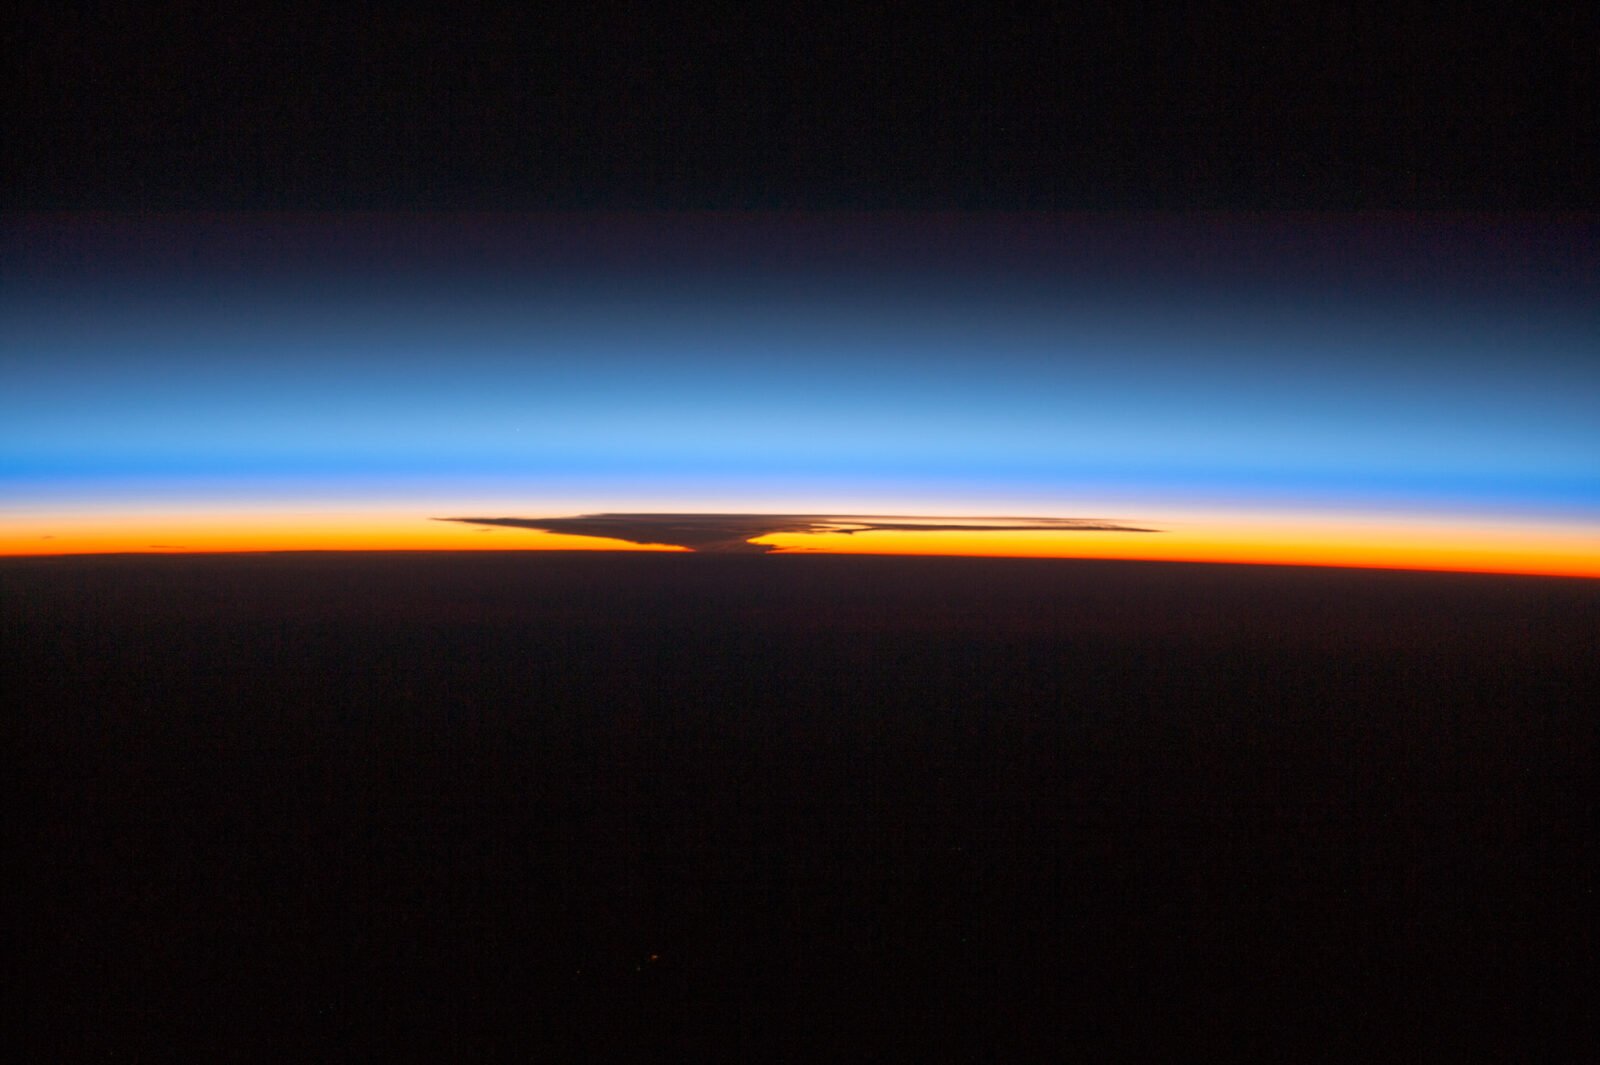
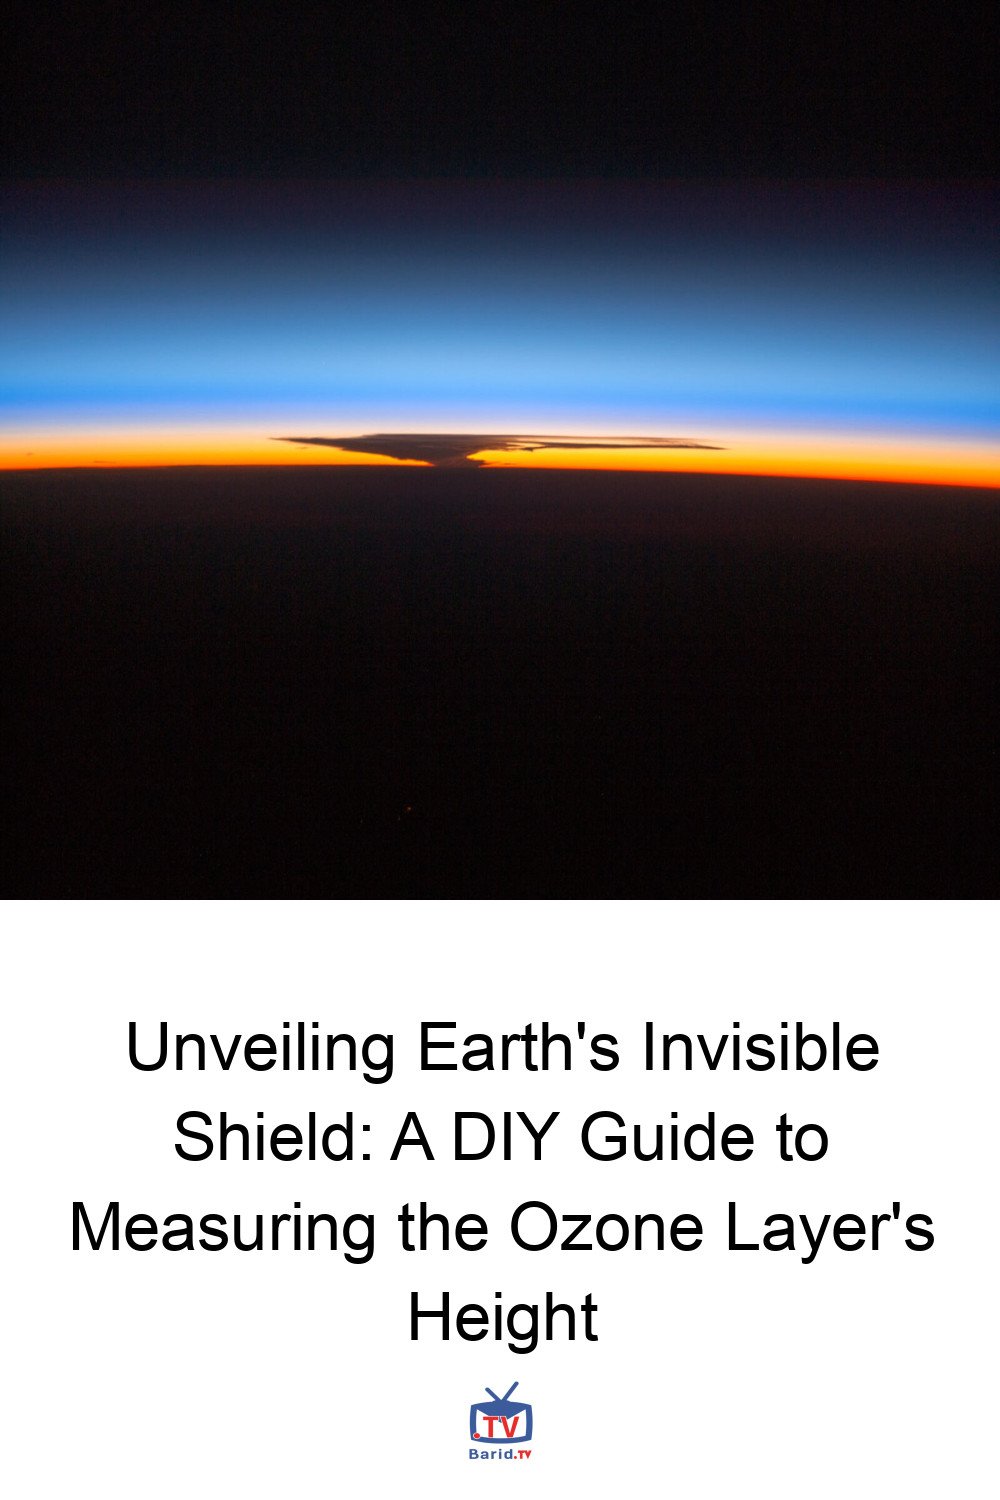
While some ozone exists at ground level, the primary protective layer begins in the stratosphere, just above the troposphere where our weather unfolds. This critical boundary is known as the tropopause. You can witness this transition during a powerful thunderstorm, as their iconic anvil-shaped tops flatten precisely at the tropopause. Astronauts, too, observe the ozone layer as a distinct blue band at sunset, as captured in a stunning 2014 ISS photograph over Papua, New Guinea, showcasing a massive thunderhead over Australia. This image beautifully illustrates the upper troposphere (orange), the stratosphere above the storm, and the thick blue band of the main ozone layer, with the lighter blue indicating the mesosphere beyond.
Despite its vital role, the ozone layer is surprisingly thin. If all the ozone directly above you were compressed to sea level pressure, it would form a layer barely 2.5 to 3.5 millimeters thick – roughly the height of two stacked pennies! In the central United States, this peak thickness typically occurs around 25km (15.5 miles) and thins out by 40km (24.85 miles).
Why Measure the Ozone Layer’s Height?
Understanding the ozone layer’s altitude is more than just a scientific curiosity; it’s crucial for tracking atmospheric circulation patterns, predicting rainfall, and monitoring its ongoing recovery from the damage caused by CFCs. Beyond these established reasons, continuous measurement can also reveal unexpected changes driven by unknown atmospheric phenomena.
Our journey into ozone measurement follows in the footsteps of pioneers like F.W.P. Götz, who, in 1930, made the first measurements of the ozone layer’s height over Arosa, Switzerland. He used a bulky Dobson spectrophotometer, an instrument the author himself calibrated as the world standard for NOAA at Hawaii’s Mauna Loa Observatory in 2016. While Dobson measurements are complex, leading to a preference for satellite data today, the quest for simpler, ground-based methods continues.
The Breakthrough: Twilight Photometry
For years, the author sought to develop a more accessible ground-based method, leading to the innovation of twilight photometry. While ozone’s strongest absorption occurs in ultraviolet (UV) wavelengths, French chemist James Chappuis discovered in 1880 that ozone also absorbs a broad band of visible light, peaking around 575nm (yellow) and 603nm (orange). Building on this, O.R. Wulf of the Smithsonian Astrophysical Observatory observed variations in the ozone column during twilight due to this ‘Chappuis absorption’ in 1954.
The author’s breakthrough came on July 20, 2016, at the Mauna Loa Observatory. Using a twilight photometer equipped with a 620nm LED detector and a massive 20-gigohm feedback resistor, he successfully measured the ozone layer’s height. The photometer recorded a peak altitude of 25.3km (15.7 miles), remarkably close to the 25.9km (16.1 miles) measured by a balloon-launched ozonometer from Hilo – a difference of only 0.6km (0.4 mile), or about 2.5%.
A Handheld Window to the Atmosphere’s Layers
It’s truly astonishing that a relatively simple, handheld instrument can accurately gauge the heights of various atmospheric layers. Beyond the ozone layer (25–35km or 15.5–21.8 miles), twilight photometry can pinpoint the tropopause (10–15km or 6.2–9.3 miles), aerosol layers (5–25km or 3.1–15.5 miles), and even the elusive meteor smoke in the thermosphere (80–110km or 49.7–68.4 miles).
Dynamic Ozone: Daily Fluctuations and Unseen Forces
The ozone layer isn’t static; its peak altitude can shift significantly even within a single day due to stratospheric disturbances. The author’s own observations from Texas, capturing morning and evening plots, vividly illustrate these daily changes. For those keen to explore further, various satellite-measured ozone profiles are readily available online, and AI resources like Grok and ChatGPT can assist in research. It’s worth noting that while most ozone plots show peak ozone on the right, twilight photometer data reverses this, indicating a decline in the twilight signal when ozone is present.
Conclusion
The ability to measure such critical atmospheric phenomena with accessible tools empowers amateur scientists to contribute to our understanding of Earth’s protective blanket. This DIY approach to tracking the ozone layer’s height not only connects us to a rich history of scientific discovery but also opens new avenues for personal exploration, allowing curious minds to observe and understand the dynamic forces shaping our planet’s vital atmospheric shield.
For more details, visit our website.
Source: Link